Content
E-Commerce
Nov 18, 2026
Too Much Stock, Too Many Stockouts: Diagnose the Planning Gap
Time to read: 6 minutes

A full warehouse can coexist with empty shelves because inventory is not one interchangeable pool. The wrong SKU, location, pack size or arrival date cannot satisfy the order waiting now. For a COO or CFO, the useful question is where purchasing and allocation decisions diverge from demand—not whether the business owns enough stock in total.
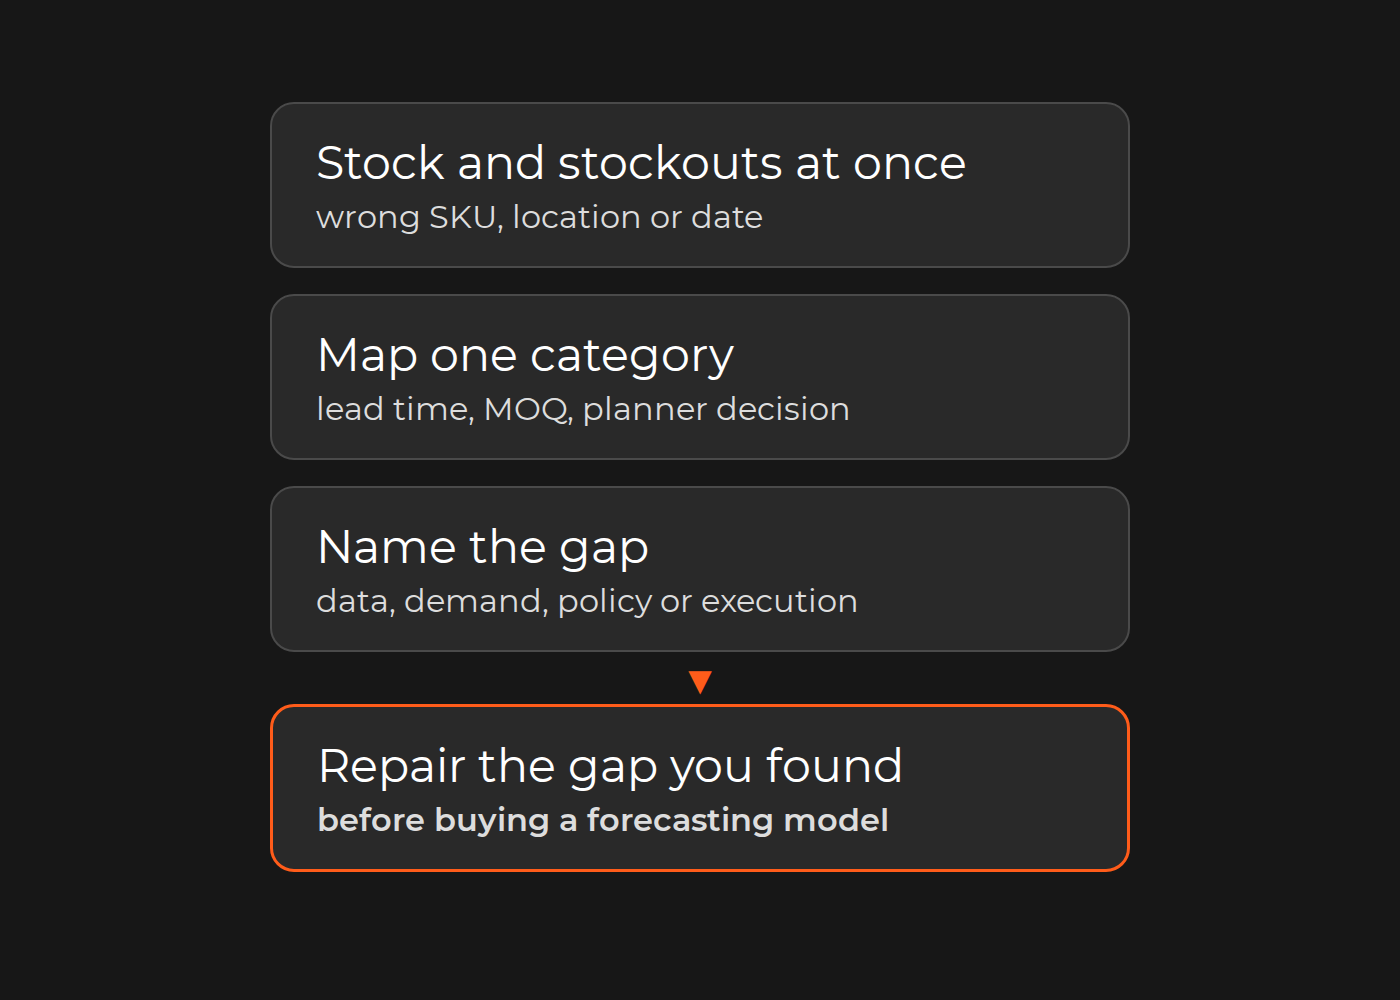
Start with one category and separate four possible gaps: unreliable data, missed demand patterns, purchasing policy and execution. A stockout-and-overstock map connects the symptom to lead time, minimum order quantity (MOQ) and the planner's actual decision. It helps you choose what to repair before buying a forecasting model.
Sales are observable; unmet demand often is not
Recorded sales show what customers bought under the availability and offer conditions they encountered. When an item cannot be purchased, low or zero sales do not establish low demand. This is censored sales history: purchases prevented by unavailability are not observed. Conversely, a zero-sales day with verified availability may genuinely reflect no purchases—but could also involve a closed store, hidden listing or data failure.
Retain sellable-availability flags by SKU, location and time interval. Separate sellable stock from reserved, damaged or unavailable stock. Keep returns separate from gross unit sales, agree how resalable returns enter inventory, and record promotions and price changes. If availability history is missing, record that gap rather than filling it with zero demand.
Consider fictional SKU A: 60 units sold in seven days, with the item unavailable for three full days. The observed calendar-day rate is 60 ÷ 7 = 8.57 units, rounded. If the other four days were fully available, the available-day rate is 60 ÷ 4 = 15 units. These are different denominators, not competing estimates of known total demand.
Extending 15 units across the unavailable days assumes comparable daily demand, no promotion effects and no substitution or delayed purchasing. Those assumptions are not established here. The example does not demonstrate 45 lost sales; it shows why an unqualified weekly total can be a misleading training signal.
Use a category-level diagnostic map
The records below are fictional, not a client audit. Quantities are individual units. A's availability is measured in days; B's sales rate and cover use weeks. Lead times have their own labels, and C's transfer timing is unknown.
A / North — availability problem. Sixty units sold over seven days; unavailable for three full days; supplier lead time two weeks. First investigate whether purchasing or late receipts explain the empty days. Preserve the availability gap when evaluating demand.
B / North — possible policy problem. Three hundred sellable units now; recent sales of 10 units/week; MOQ 200 units; lead time one week. Simple cover is 300 ÷ 10 = 30 weeks, assuming the recent rate continues and all stock remains usable. This ratio does not prove excess: a future peak or service commitment may justify stock. Compare the purchase batch and stock age with a finance-approved planning horizon.
C / North and South — possible allocation problem. North is unavailable while South has stock. Check regional demand, transfer permission, transport cost and arrival time before treating this as a network-wide shortage. Stock elsewhere is useful only if it can reach the customer in time.
For your own map, add the last purchase decision, expected and actual receipt dates, pack size, reservations, stock age and the person who approved the exception. These records identify investigations, not replenishment quantities or confirmed excess.
Diagnose four different gaps
Begin with a reconciled sample; then follow the evidence rather than assuming every category needs the same sequence of fixes. Several gaps can coexist.
Data gap. Inventory timestamps lag sales, returns are netted inconsistently or reserved stock appears available. IT and the inventory owner should reconcile a sample across ERP, WMS and commerce. Do not judge a forecast against an unexplained mismatch in its inputs.
Execution gap. Approved orders arrive late, receipts are delayed or stock remains at the wrong location. Operations should compare the approved plan with actual receipts and transfers. Calling this “forecast error” can send the project in the wrong direction.
Policy gap. Forecasts are reasonable, but MOQ, pack size, reorder points, safety stock, service targets or review frequency create large batches or late orders. Planning and procurement should replay the actual rule on a sample item. A lower forecast error will not change an unavoidable supplier minimum.
Demand-model gap. A seasonal or promotion pattern is repeatedly missed despite usable availability history and understood supply constraints. A planning specialist should compare the current method with a simple seasonal baseline before proposing a more complex model.
Any historical comparison must respect what was known at the planning date. Forecasting: Principles and Practice describes rolling-origin evaluation, where training uses only earlier observations. Run that kind of evaluation only after this diagnosis has established which gap deserves the test.
Repair the data connection without confusing it with forecasting
Dinarys' SanMar case describes a concrete integration component: the team built a custom connector that converted legacy ERP data into formats required by Magento, connecting the client's ERP with its B2C and B2B websites for real-time product and order data exchange. That is relevant when the category map exposes inconsistent availability or disconnected records.
For the allocation gap in example C, the Undrgoods case describes configuring advanced inventory synchronization across all three of the brand's regional stores. Stock that is visible by location is a precondition for judging whether South's units could serve North in time; it does not make the transfer decision for you.
Both cases describe ERP/commerce integration and inventory synchronization work, not a delivered demand model or validated inventory-optimization result. A forecasting or replenishment pilot still needs a qualified planning specialist responsible for the model and inventory policy. ERP integration services are the relevant engineering path when the first gap is the connection between systems.
Pick one category you can review
Supply chain or the COO should own the process; planners validate history and overrides; finance accepts the service/working-capital trade-off; IT/ERP accepts data and integration boundaries. Confirm who authorizes spend. Do not substitute a marketing sponsor for the operational planning owner.
Choose a category with a real imbalance, usable sales and stock history, known supplier constraints and a planner able to review recommendations beside the current plan. If those inputs are absent, repair observability and ownership first. Compare availability, stock age and inventory value together: higher availability may simply reflect holding more stock.
Once the gap is clear, choose between maintaining ERP rules, using a planning platform and commissioning specialist modeling. Before selecting a delivery team, define what planners must be able to override and how a pilot will be accepted. Neither decision requires autonomous purchasing.
To discuss the data connection, contact Dinarys with a sanitized category map, one mismatched record, your systems list and the planning owner's accepted data limits. The useful next commitment is a pilot category and clear responsibilities—not a promised reduction in inventory or stockouts.


Let professionals meet your challenge
Our certified specialists will find the most optimal solution for your business.