Content
E-Commerce
Nov 18, 2026
Promotions Grow Revenue but Leave You With Less Margin
Time to read: 5 minutes

The campaign report says revenue rose. Finance sees less contribution, and the aging stock is still there. These outcomes can coexist: more units sold at a lower contribution per unit, while the discount reached products or customers that did not need it.
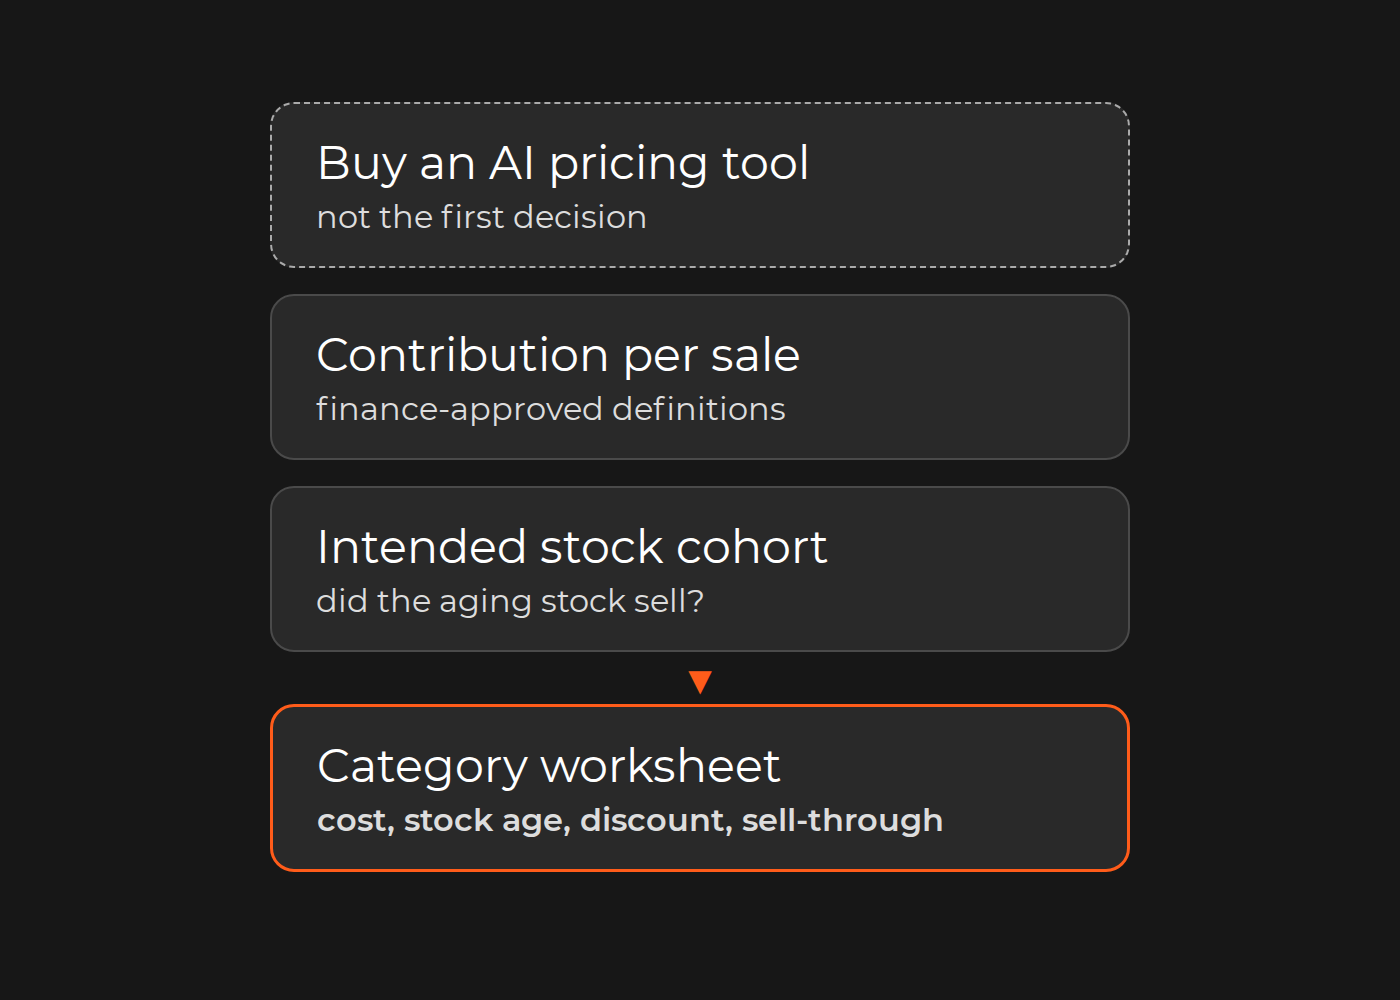
For a CMO, commercial director or CFO, the first decision is which category needs diagnosis—not whether to buy an AI pricing tool. Build a cost–stock age–discount–sell-through worksheet. It should reveal what sold, what each sale contributed and which stock remains.
Revenue rose—but what did each sale contribute?
Revenue, gross margin, contribution and cash recovery are not interchangeable. Have finance approve the category's definitions. A practical contribution view starts with net realized sales after discounts and refunds, then subtracts product cost and agreed variable selling/fulfillment costs. Track campaign costs separately if appropriate, but subtract them only once.
The following comparison is fictional. Assume one product, USD, tax-exclusive prices, the same measurement window and a fixed cost basis of $60 product cost plus $10 variable selling/fulfillment cost per unit. Exclude returns, shipping revenue, supplier funding and effects on other products. These are hypothetical scenarios, not customer results or a demand forecast.
| Measure | No promotion | Promotion |
|---|---|---|
| Selling price/unit | $100 | $80 |
| Units sold | 100 | 150 |
| Revenue | $10,000 | $12,000 |
| Contribution/unit before campaign | $30 | $10 |
| Total before campaign | $3,000 | $1,500 |
| Additional campaign cost | $0 | $300 |
| Contribution after campaign | $3,000 | $1,200 |
No promotion: 100 × ($100 − $60 − $10) = $3,000. Promotion: 150 × ($80 − $60 − $10) − $300 = $1,200. Revenue rises by $2,000, or 20%, while contribution before campaign cost falls by $1,500. After campaign cost, the scenario difference is −$1,800. That is arithmetic under assumptions, not proof that a real promotion caused a loss.
At $10 contribution per promotional unit, 330 units would be needed to match $3,000 after the $300 campaign cost. At 400 units, contribution would instead be 400 × $10 − $300 = $3,700. Neither quantity predicts demand. Promotions can win; revenue alone cannot tell you which case you are in.
The discount cleared stock—but was it the intended stock?
A campaign that sells new arrivals while leaving the old sizes untouched can succeed on revenue and fail its clearance objective. Join each sale to the intended stock-age cohort before declaring that the markdown worked.
In a separate fictional cohort calculation, assume 500 aging units at campaign start, no receipts, returns or transfers, and all 150 promotional sales coming from that cohort. Sell-through is 150 ÷ 500 = 30%; 350 remain. If the sales came from newer receipts instead, this aging-cohort result would not follow.
Record remaining stock, age, likely future recovery and holding or disposal assumptions separately. Do not count the full book value of remaining stock as a newly realized loss merely because the campaign ended. Nor should modeled future clearance be reported as earned profit.
Attributed sales are not incremental sales
To estimate incremental sales, investigate whether discounts reached already-strong sellers, whether another product lost sales (cannibalization), and whether purchases were pulled forward from following weeks. Some customers would have bought anyway. Campaign attribution does not show incremental contribution: the contribution that would have been absent without the promotion.
A week-before/week-after comparison is vulnerable to holidays, weather, availability and channel changes. Shopify's sell-through discussion recommends like-for-like periods and attention to seasonality; its general benchmarks are not targets for this category.
A credible live comparison needs a pricing/measurement specialist to choose suitable units and a window that includes returns and post-promotion effects. Cross-channel shopping, substitution and shared advertising can contaminate a control. Record those limits rather than assigning all change to the campaign or AI.
Past markdowns do not automatically reveal price elasticity
Low sales at a price may reflect a stockout, not customer rejection. Historical markdowns are also selected decisions, often applied to slow sellers. A correlation between low prices and low sales is not a causal price-response estimate.
There is no defensible category-specific AI margin-improvement figure without a baseline and a credible comparison group. Ask for both before believing the number. Compare the current markdown plan and simple business-approved rules before evaluating an optimizer. Setting price constraints before trusting any AI recommendation is the next decision; choosing a markdown optimization partner comes after the constraints and measurement method are clear.
Pull a usable category worksheet
For one category and period, assemble these records on a common time basis:
- Identity: SKU, location/channel and stock-age cohort. Did the intended old stock sell?
- Movements: opening stock, receipts, returns, transfers and write-offs. Is the sell-through denominator understood?
- Realized price: actual transaction price after stacked discounts and loyalty reductions—not today's catalog price.
- Cost: finance-approved product and variable costs applicable at the transaction time. Flag missing history rather than declaring margin compliance.
- Campaign economics: campaign charges and supplier support, with inclusion and timing agreed so each is counted once.
- Outcome and comparison: cohort sell-through, ending stock, contribution, comparison method and its limitations.
Where the obstacle is joining channel and ERP records, Dinarys' Prostor case shows what that reconciliation involves. The case page describes an omnichannel drugstore chain with 427+ locations and 50,000+ SKUs, a custom loyalty/bonus program unifying offline and online loyalty states, and ERP/CRM integrations through a custom ERP API layer. It also reports that ERP synchronization in the early sprints produced inventory-state inconsistencies that needed manual reconciliation; they were resolved during the first month of post-migration operations by adjusting sync frequency and adding a validation layer. Loyalty reductions, stock states and channel sales are the same records this worksheet joins. The case does not show causal price elasticity or a delivered price optimizer.
ERP integration services are the appropriate route for discussing that data connection, with a qualified pricing specialist responsible for the economic method.
Choose a category with aging stock or deteriorating contribution, usable historical costs/prices and an accountable merchandiser or pricing owner. Finance accepts the baseline; commercial/marketing owns the objective; IT owns reconciliation. Confirm who approves budget and pricing policy.
If simple margin rules resolve the problem, use them. If missing data prevents a controlled category program, contact Dinarys with a sanitized worksheet, one discount-stacking example, systems list and the unresolved historical-data gaps. Keep pricing authority with your commercial and policy owners; an integration discussion is not permission to change prices.


Lassen Sie Profis Ihre Herausforderung meistern
Unsere zertifizierten Spezialisten finden die optimale Lösung für Ihr Unternehmen.