Content
E-Commerce
Supply Chain Visualization: Ways, Tools & Benefits


Visualizing your supply chain is key for keeping track of all the moving parts. That's why Dinarys has put together this comprehensive supply chain visualization guide to help you better understand and manage your entire supply chain. This guide will walk you through the fundamentals of supply chain visualization, from understanding why it’s important to utilize powerful tools to help visualize your entire supply chain. By the end of this guide, you'll have a better understanding of how to effectively visualize and manage your supply chain. Let's get started!
Benefits of Supply Chain Data Visualization
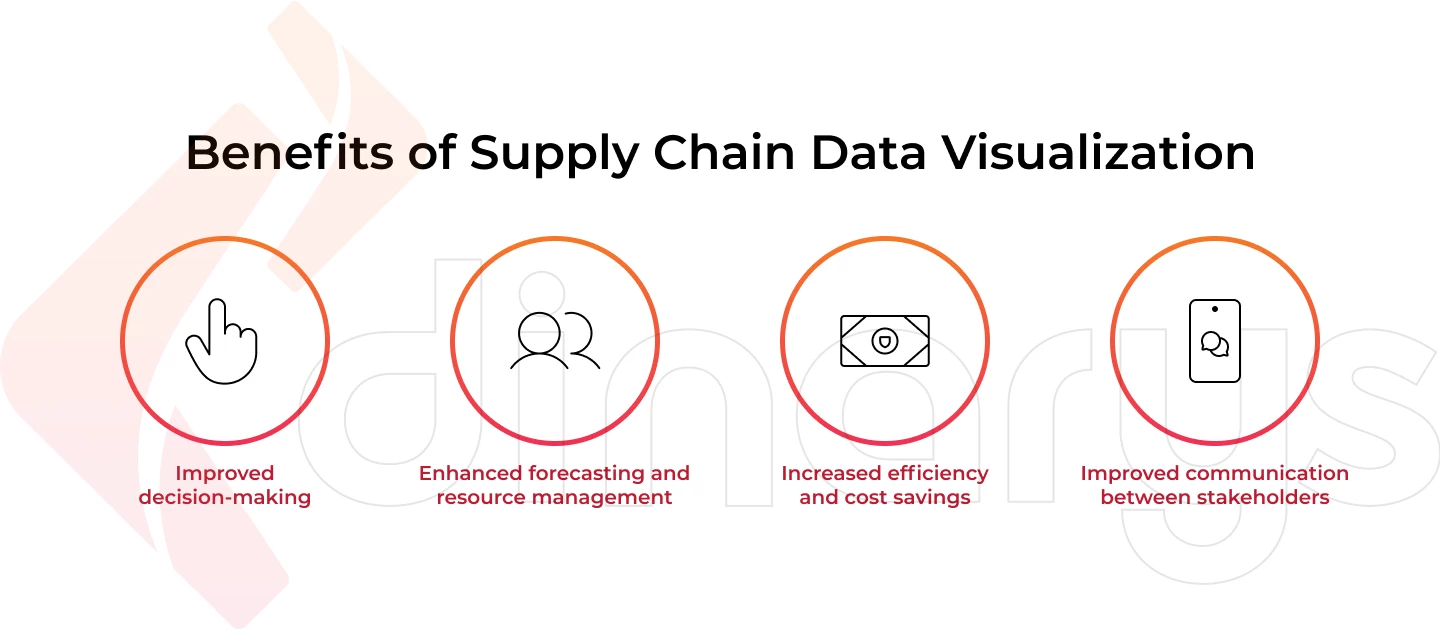
Data visualization is a powerful tool that can help businesses gain insight into their supply chain operations. By leveraging the power of data visualizations, businesses can optimize processes, reduce costs and increase efficiency in their supply chain network. With the right insights from data visualizations, businesses can make better decisions faster, improve forecasting strategies and manage resources more effectively. Furthermore, data visualization also improves communication between stakeholders across the entire supply chain process by providing an easy-to-understand view of key performance indicators and other important information. Ultimately, it provides the necessary contextual understanding to help drive positive business outcomes. Among the main benefits of supply chain data visualization are:
1) Improved decision-making – By understanding how data is connected, businesses can make more informed decisions that are based on a broader view of the supply chain network.
2) Enhanced forecasting and resource management – Companies can plan their inventory better by leveraging insights from data visualizations. This information can help them forecast demand and manage their resources accordingly.
3) Increased efficiency and cost savings – Data visualization enables companies to identify areas for improvement in the supply chain process, thus leading to increased efficiency throughout the entire system and helping reduce costs.
4) Improved communication between stakeholders– When all stakeholders have access to clear visuals showing the performance of the supply chain, it helps create a common language among them and encourages collaboration.
With Dinarys’ Supply Chain Visualization Guide, businesses can easily access the insights they need to stay competitive. Our guide provides all the necessary information managers need to understand how data visualizations can be used to improve their supply chain operations. Furthermore, Dinarys’ experienced team of experts can provide additional guidance and support for successful implementation. Start leveraging the power of data visualization today and make sure your business stays ahead of the competition!
7 Types of Visualization of Your Supply Chain
Supply chain visualization is an essential tool in understanding and managing the complex relationships between suppliers, customers, and other stakeholders. To help you quickly get up to speed on the different types of supply chain visualizations available, we’ve compiled a guide that outlines 10 popular types of supply chain visualizations.
Process Flow Maps
Process flow maps show the sequence of steps involved in a process. They are helpful for documenting an existing process or designing a new one. It's also possible to map out the information flow, as well as indicate decision points and items that are stored in warehouses. You can also see how long each step takes and identify areas of improvement.
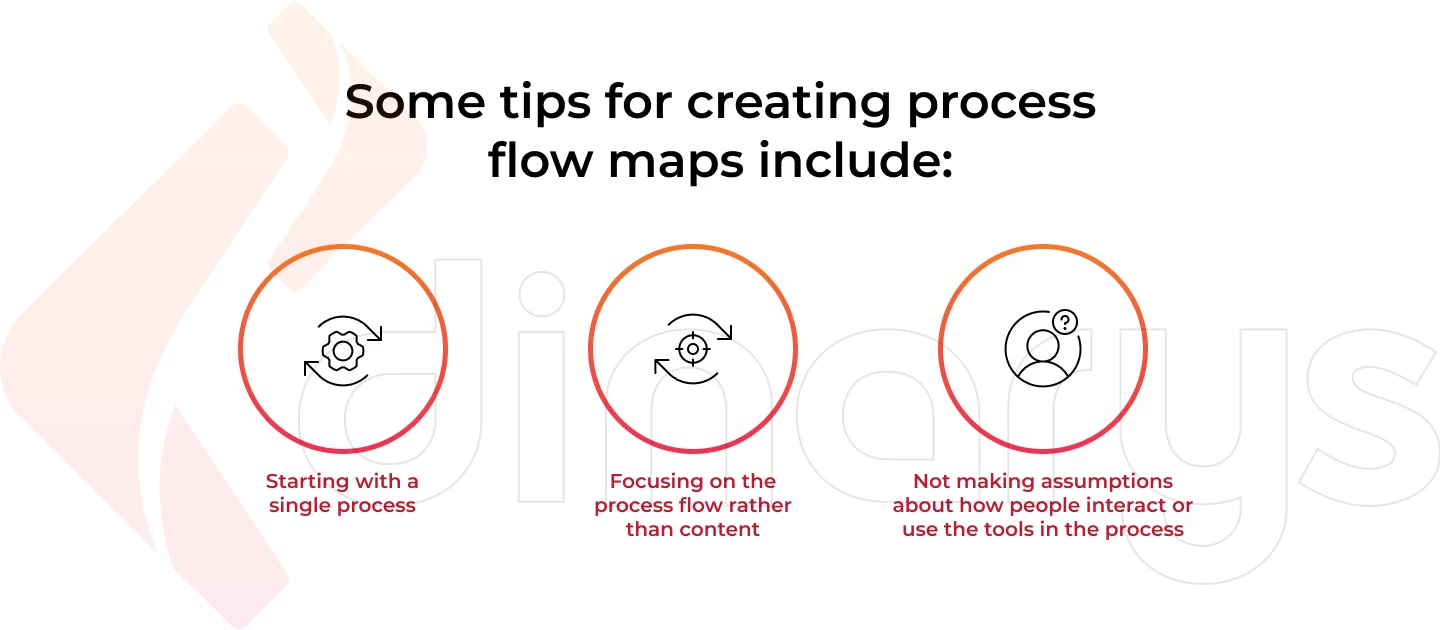
Some tips for creating process flow maps include:
- Starting with a single process,
- Focusing on the process flow rather than content,
- Not making assumptions about how people interact or use the tools in the process.
Network Diagrams
Network diagrams are used to illustrate relationships between people and organizations in a supply chain. They help to define roles and responsibilities, as well as help to identify potential bottlenecks or areas for improvement.
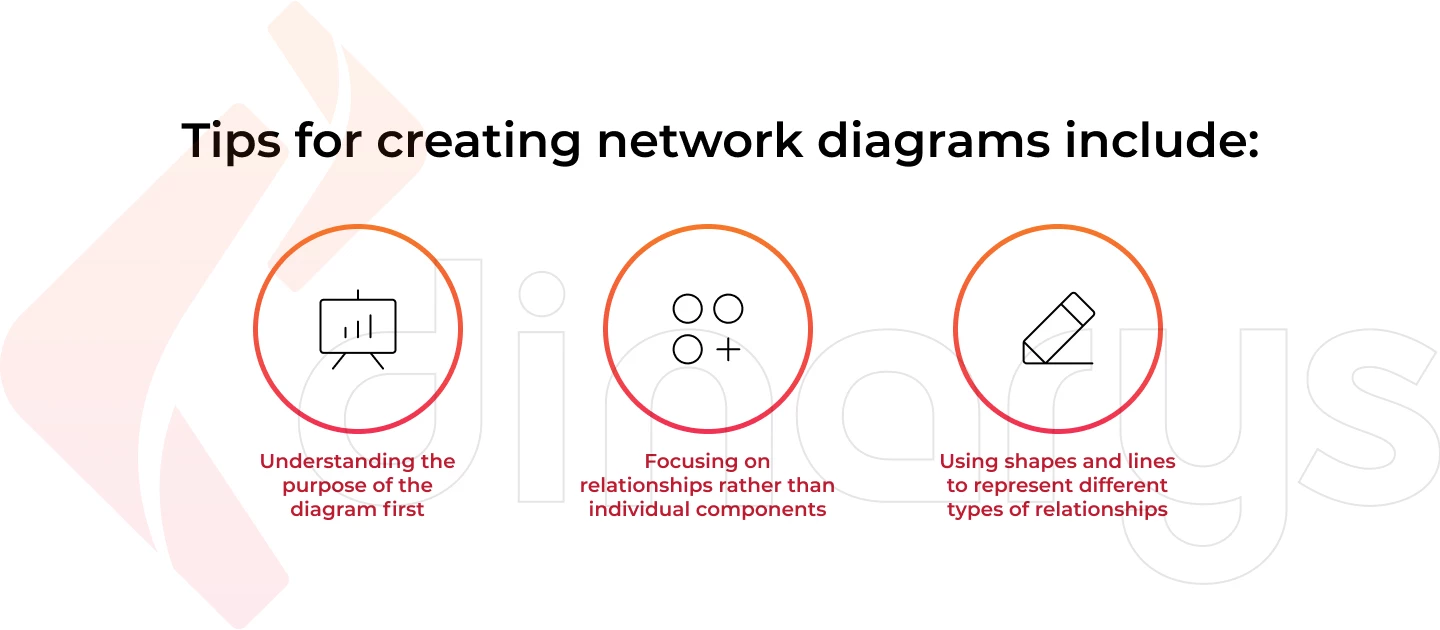
Tips for creating network diagrams include:
- Understanding the purpose of the diagram first,
- Focusing on relationships rather than individual components,
- Using shapes and lines to represent different types of relationships.
Heat Maps
Heat maps are used to visualize data in a two-dimensional format, helping to quickly identify areas of strength or weakness. They are useful for identifying trends and patterns, as well as understanding the impact of changes in a process or system.
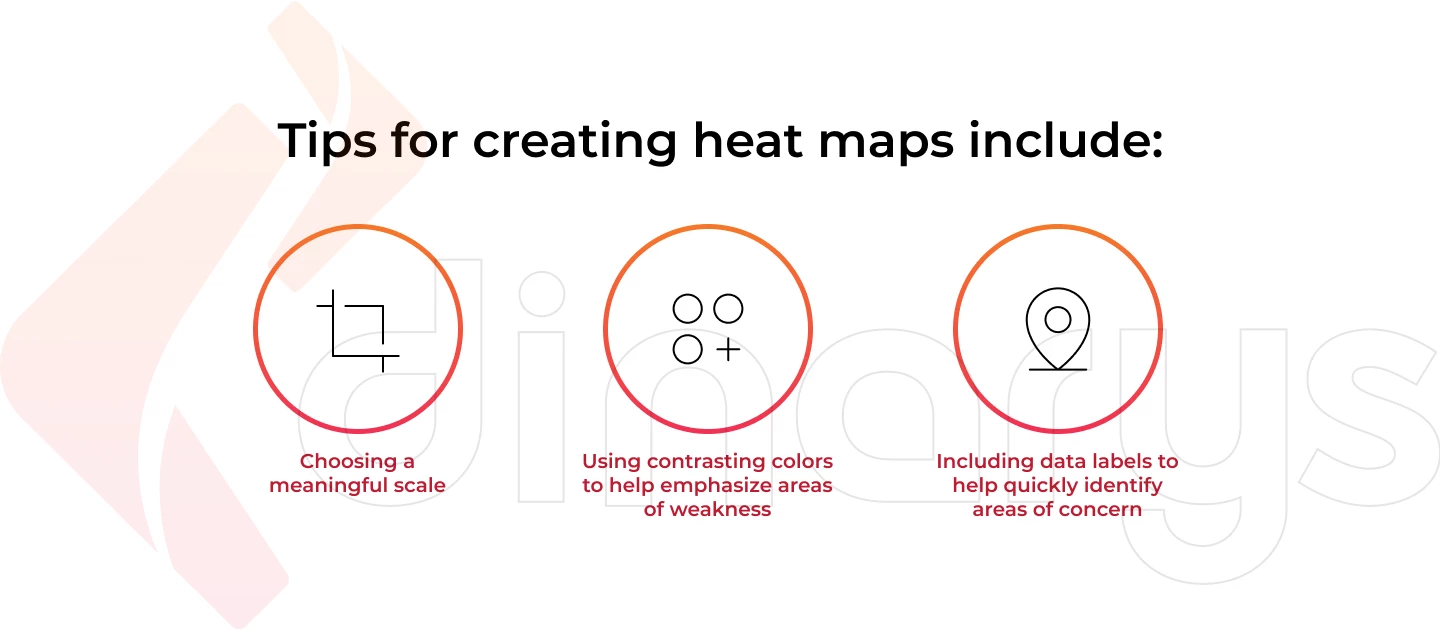
Tips for creating heat maps include:
- Choosing a meaningful scale,
- Using contrasting colors to help emphasize areas of weakness,
- Including data labels to help quickly identify areas of concern.
Geographic Maps
Geographic maps are useful for visualizing the geographic locations of suppliers, customers, and other stakeholders in a supply chain. They can also be used to track shipments and visualize patterns or trends by location.
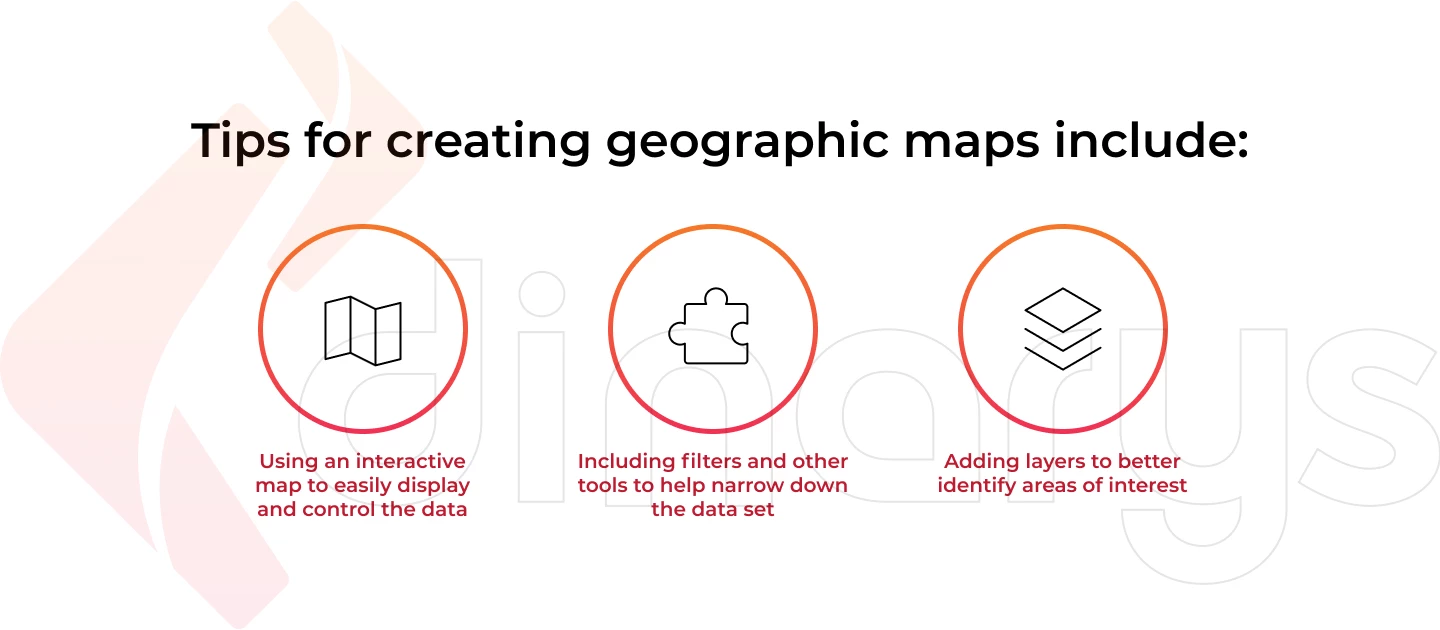
Tips for creating geographic maps include:
- Using an interactive map to easily display and control the data,
- Including filters and other tools to help narrow down the data set,
- Adding layers to better identify areas of interest.
Sequence Diagrams
Sequence diagrams are used to illustrate the flow of information between different entities in a process. They help to identify areas of conflict or complexity, as well as indicate possible areas for improvement.
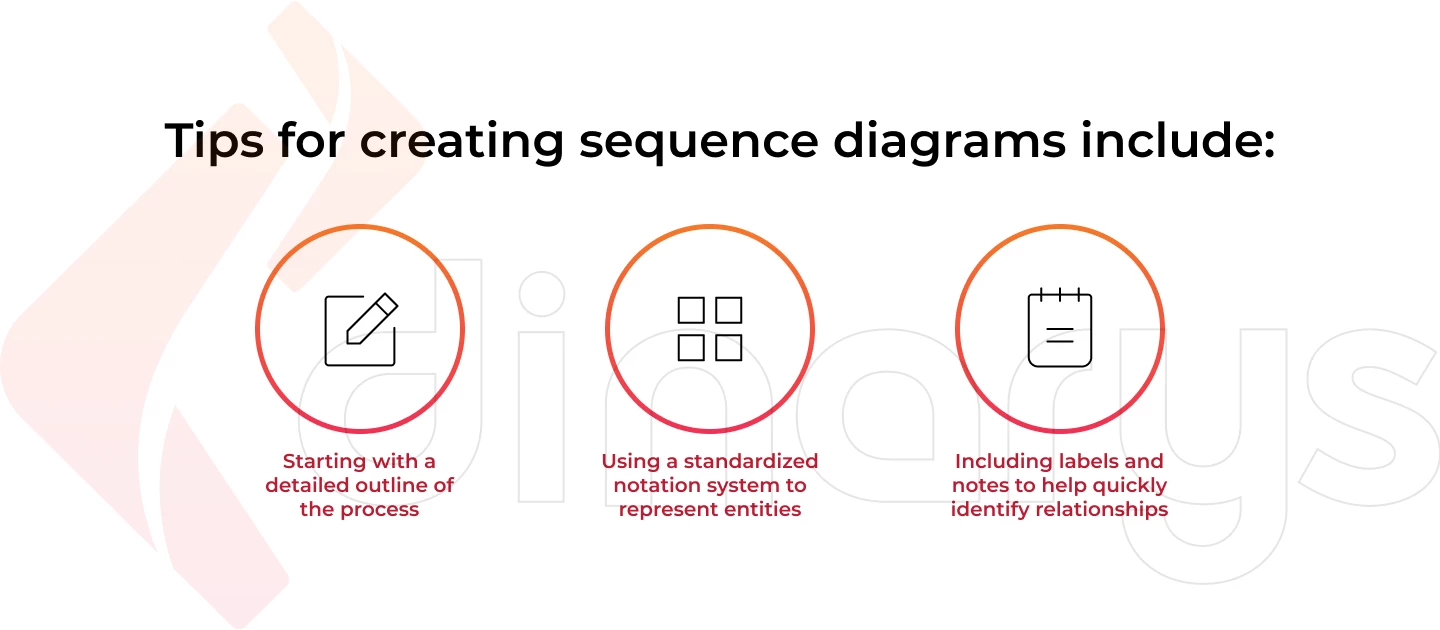
Tips for creating sequence diagrams include:
- Starting with a detailed outline of the process,
- Using a standardized notation system to represent entities,
- Including labels and notes to help quickly identify relationships.
Dashboards
Dashboards are used to provide an overview of key metrics and performance indicators in a supply chain. They can be used to quickly identify areas for improvement, as well as track current performance.
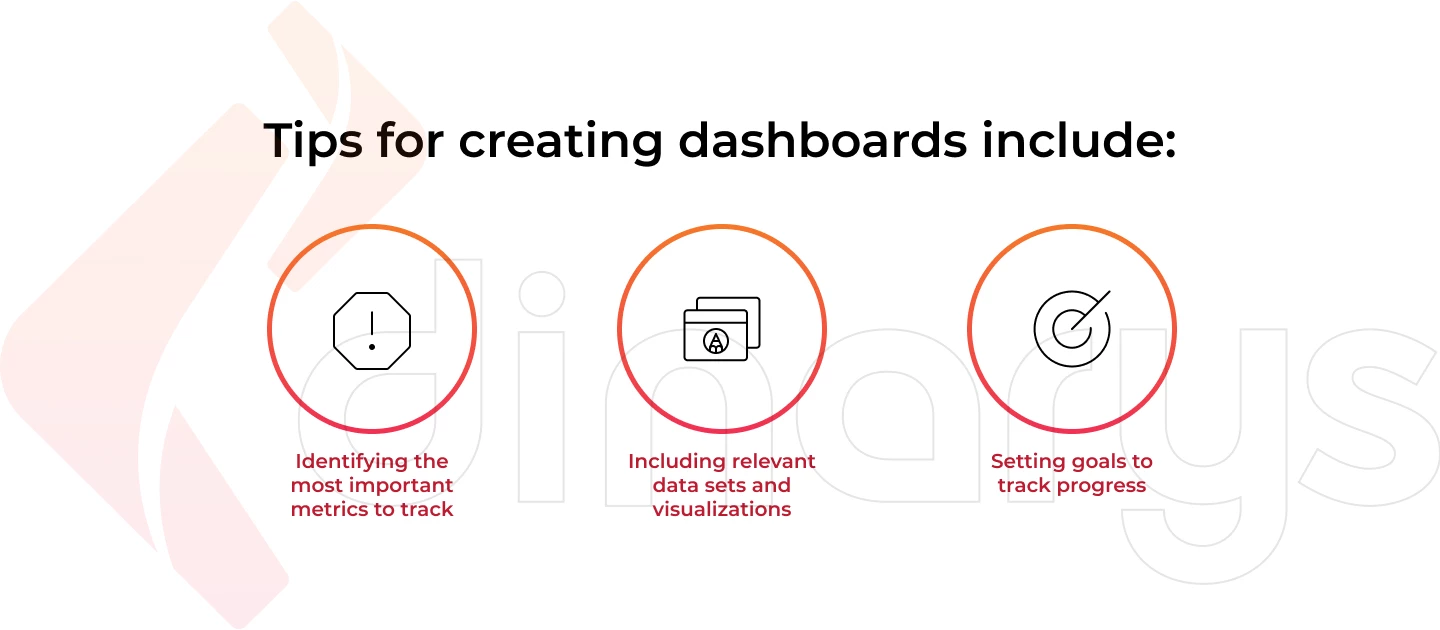
Tips for creating dashboards include:
- Identifying the most important metrics to track,
- Including relevant data sets and visualizations,
- Setting goals to track progress.
Sankey Diagrams
Sankey diagrams are useful for visualizing the flow of materials, resources, money, or energy in a supply chain. They provide an overview of how resources are used and can help identify areas of inefficiency or potential waste.
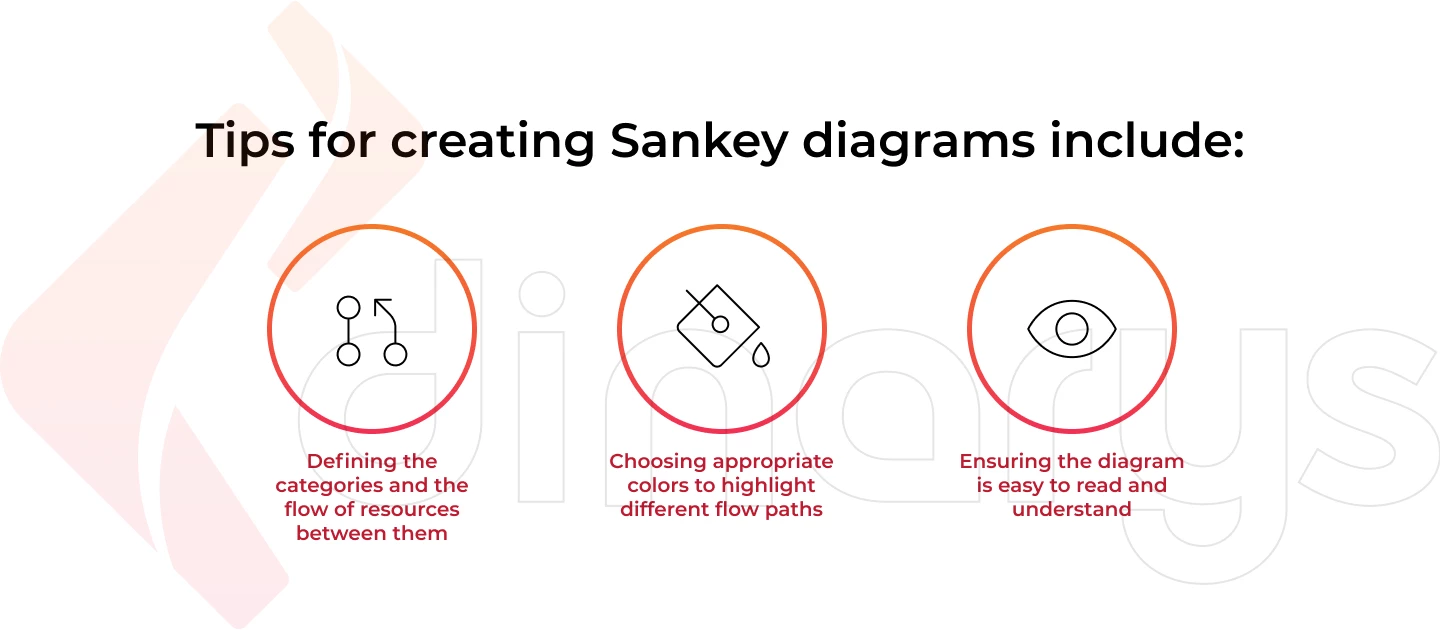
Tips for creating Sankey diagrams include:
- Defining the categories and the flow of resources between them,
- Choosing appropriate colors to highlight different flow paths,
- Ensuring the diagram is easy to read and understand.
Using visualizations in your supply chain can help to identify areas of improvement, track performance, and make informed decisions. With the right tools and knowledge, you can create effective visualizations to help optimize your supply chain. With the right visualizations, you can quickly identify problems and opportunities, and make better decisions.
By using visualizations to understand your supply chain, you can optimize performance, save time, and improve the overall efficiency of your business. The key to successfully utilizing visualizations in your supply chain is understanding the different types of visuals available, and how to best use them. The tips and tricks outlined above can help you get started on your journey toward optimized supply chain visualizations.
Supply Chain Cycles
The Supply Chain Cycle is an important concept in the world of supply chain management. It refers to the process by which a product or service moves from its initial production stages, through various stages of distribution, and then finally to the consumer. This cycle includes all activities involved in providing goods and services from suppliers to manufacturing, warehousing, distribution, and delivery to customers. An effective Supply Chain Cycle should be designed in order to optimize the overall performance of the supply chain, from cost and time efficiency to customer service. It is important that each step is monitored and evaluated in order to identify areas where improvements can be made. This will help ensure the efficient flow of goods and services while also providing a competitive edge for the company.
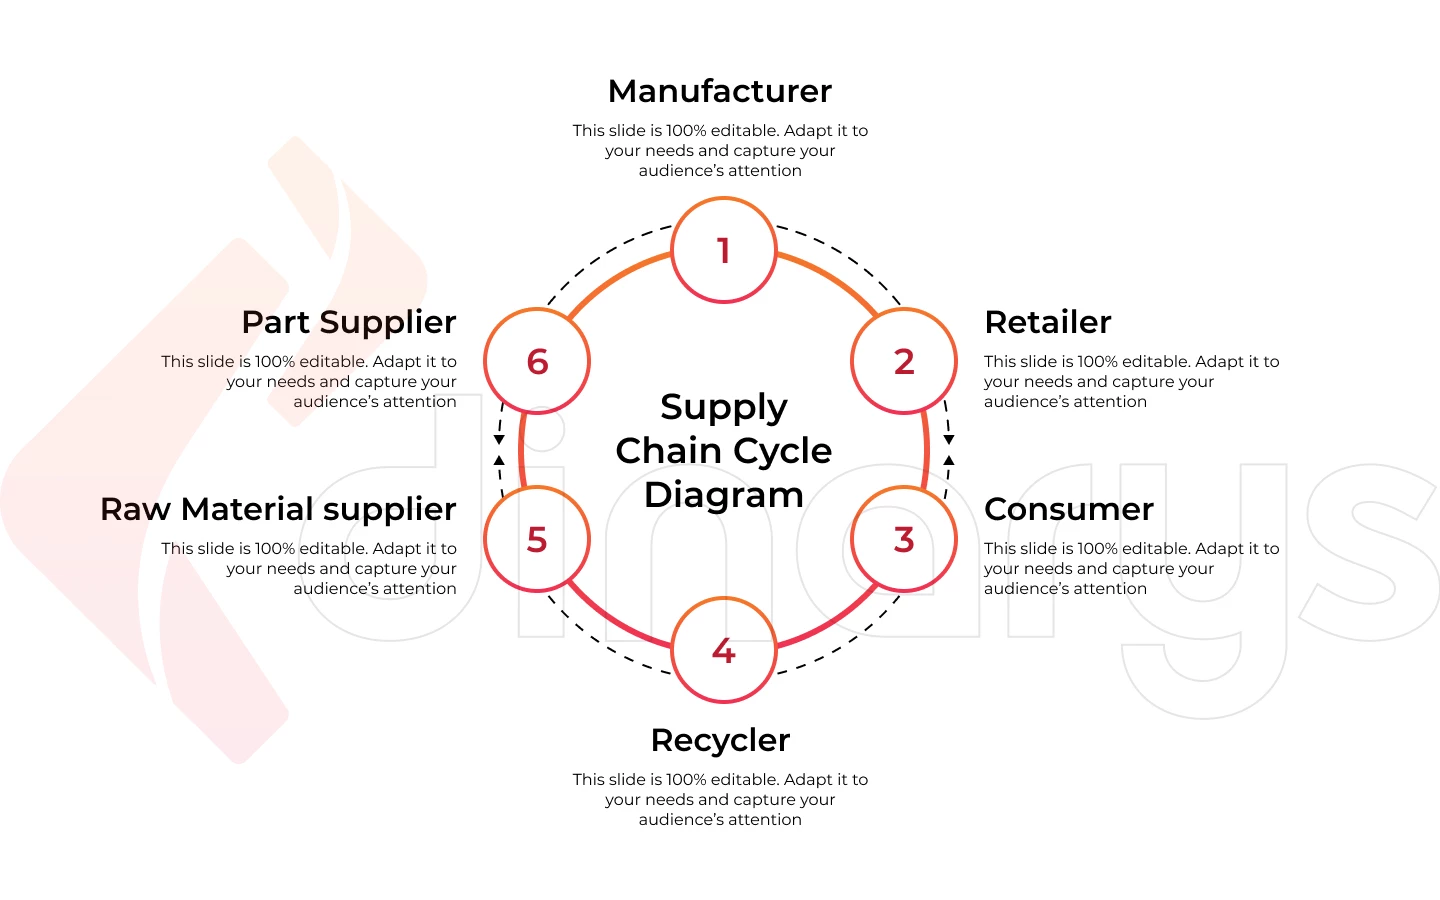
The key components of a Supply Chain Cycle can be broken down into four main steps:
Source
This is the first stage of the cycle where suppliers are identified and sourced. It is important to choose the right supplier who can provide quality goods and services at a reasonable price. During this phase, the organization will also negotiate terms and conditions such as delivery and payment.
Key components of this stage include:
- Supplier selection,
- Purchasing contracts
- Price negotiation.
Manufacture
This is the second step of the cycle where the goods or services are produced and packaged. Manufacturing processes need to be efficient in order to ensure that products are delivered on time and at cost-effective prices.
Key components of this stage include:
- Production planning,
- Inventory management manufacturing process optimization.
Distribution
This is the third stage of the cycle where products are sent from the supplier to the customer or retail outlet. It is important for distribution processes to be efficient in order to minimize costs and ensure timely delivery.
Key components of this stage include:
- Order fulfillment,
- Transportation management,
- Warehouse management.
Delivery
This is the final step of the cycle where goods or services are delivered to customers or retail outlets. It is important for delivery processes to be consistent and reliable in order to ensure customer satisfaction and brand loyalty.
Key components of this stage include:
- Order tracking,
- Shipping and delivery management,
- Customer service.
By understanding the Supply Chain Cycle and its key components, organizations can better optimize their operations for improved performance and cost savings. Furthermore, it can help to ensure that customers receive quality products and services in a timely and efficient manner. In conclusion, the Supply Chain Cycle is a vital concept for organizations to understand in order to remain competitive and operate efficiently. By understanding each step of the cycle, businesses can identify areas for improvement and ensure that goods and services are delivered on time and at cost-effective prices. This will help to create a positive customer experience and ensure customer loyalty.
Supply Сhain Visualization Tools
Supply chain visualization tools can help streamline operations, improve visibility and increase efficiency within a supply chain environment. These tools allow companies to view their production processes in real time and make informed decisions quickly. With the right supply chain visualization tool, businesses can gain insights into inventory levels, order fulfillment times, as well as supplier performance metrics. They also enable them to identify potential areas of improvement within the supply chain process. By utilizing these tools, organizations are able to maximize efficiency within their respective industries while minimizing costs associated with slow or inefficient workflows.
Some of the more popular supply chain visualization tools include:
Warehouse Management Systems (WMS)
WMS solutions are designed to help businesses maximize the efficiency of their warehouse processes, such as order picking and packing. These systems provide a comprehensive view into inventory levels, enabling organizations to better manage stock levels and maintain optimal customer service rates.
Transportation Management Systems (TMS)
TMS tools focus on improving transportation management for companies with large fleets or multiple warehouses. This type of system can help reduce costs associated with inefficient routing, as well as improve communication between suppliers and customers.
Enterprise Resource Planning (ERP) systems
Lastly, ERP systems are designed to provide an end-to-end solution for tracking all elements within a company’s supply chain process. By utilizing these powerful tools, businesses can gain greater control over their operations while ensuring that each step in the process is optimized for maximum efficiency. By leveraging a comprehensive supply chain visualization tool, businesses can gain greater insight into their operations and make informed decisions quickly.
Ultimately, supply chain visualization tools offer organizations the ability to monitor their production processes in real time and uncover potential areas of improvement. By utilizing these powerful tools, companies are able to increase efficiency and reduce costs associated with inefficient workflows.
Bottom Line
Dinarys’ Supply Chain Visualization Guide provides an in-depth look at the various types of systems available today and how they can help streamline your business operations. With Dinarys’ guide, all of your questions about supply chain visibility will be answered. Our expert team takes a deep dive into each system, offering a comprehensive overview of its features and benefits. This guide is essential for any business looking to gain insight into its supply chain operations and optimize its efficiency. Contact us today to learn more about our product offerings.
Dinarys is here to help you make the most of your supply chain visualization tools. Our team of experts can provide customized solutions tailored to the needs of any organization and provide valuable insights into their production processes. From warehouse management systems to enterprise resource planning, our team has the expertise to keep your operations running smoothly and maximize efficiency within your supply chain. Contact us today to find out how we can help your business optimize its operations with a powerful visual tool!


Lassen Sie Profis Ihre Herausforderung meistern
Unsere zertifizierten Spezialisten finden die optimale Lösung für Ihr Unternehmen.